Visual Design
Graphic Design
Brand Identity
Typography
Illustration
Color Theory
Motion Design
2D/3D Animation
After Effects
Lottie Animations
3D Modeling & CGI
VFX
User Experience (UX)
User Interface (UI)
Interaction Design
Microinteractions
Design Systems
Wireframing
Prototyping
Usability Testing
Video Editing
Color Grading
Sound Syncing
Reel & Short Edits
Storyboarding
Responsive Design
Frontend Handoff
Animation to Code
Cross-Platform UI
Performance Debugging
Creative Direction
Client Servicing
Pitch Presentations
Brief Understanding
Team Collaboration
Project Management
Content Ideation
Reel Strategy
Social Media Design
Campaign Planning
Brand Storytelling
Real Esate Sales Manager CRM (Site Visit to Booking & Home Loan)
-
Type
Web App + Mobile App UI/UX
-
Role
Lead UI/UX Designer -
Duration
3–4 Weeks -
Tools
Figma, Photoshop, Apache ECharts (prototype)


User Flow Diagram
Interactive Prototype
Links
Project Description
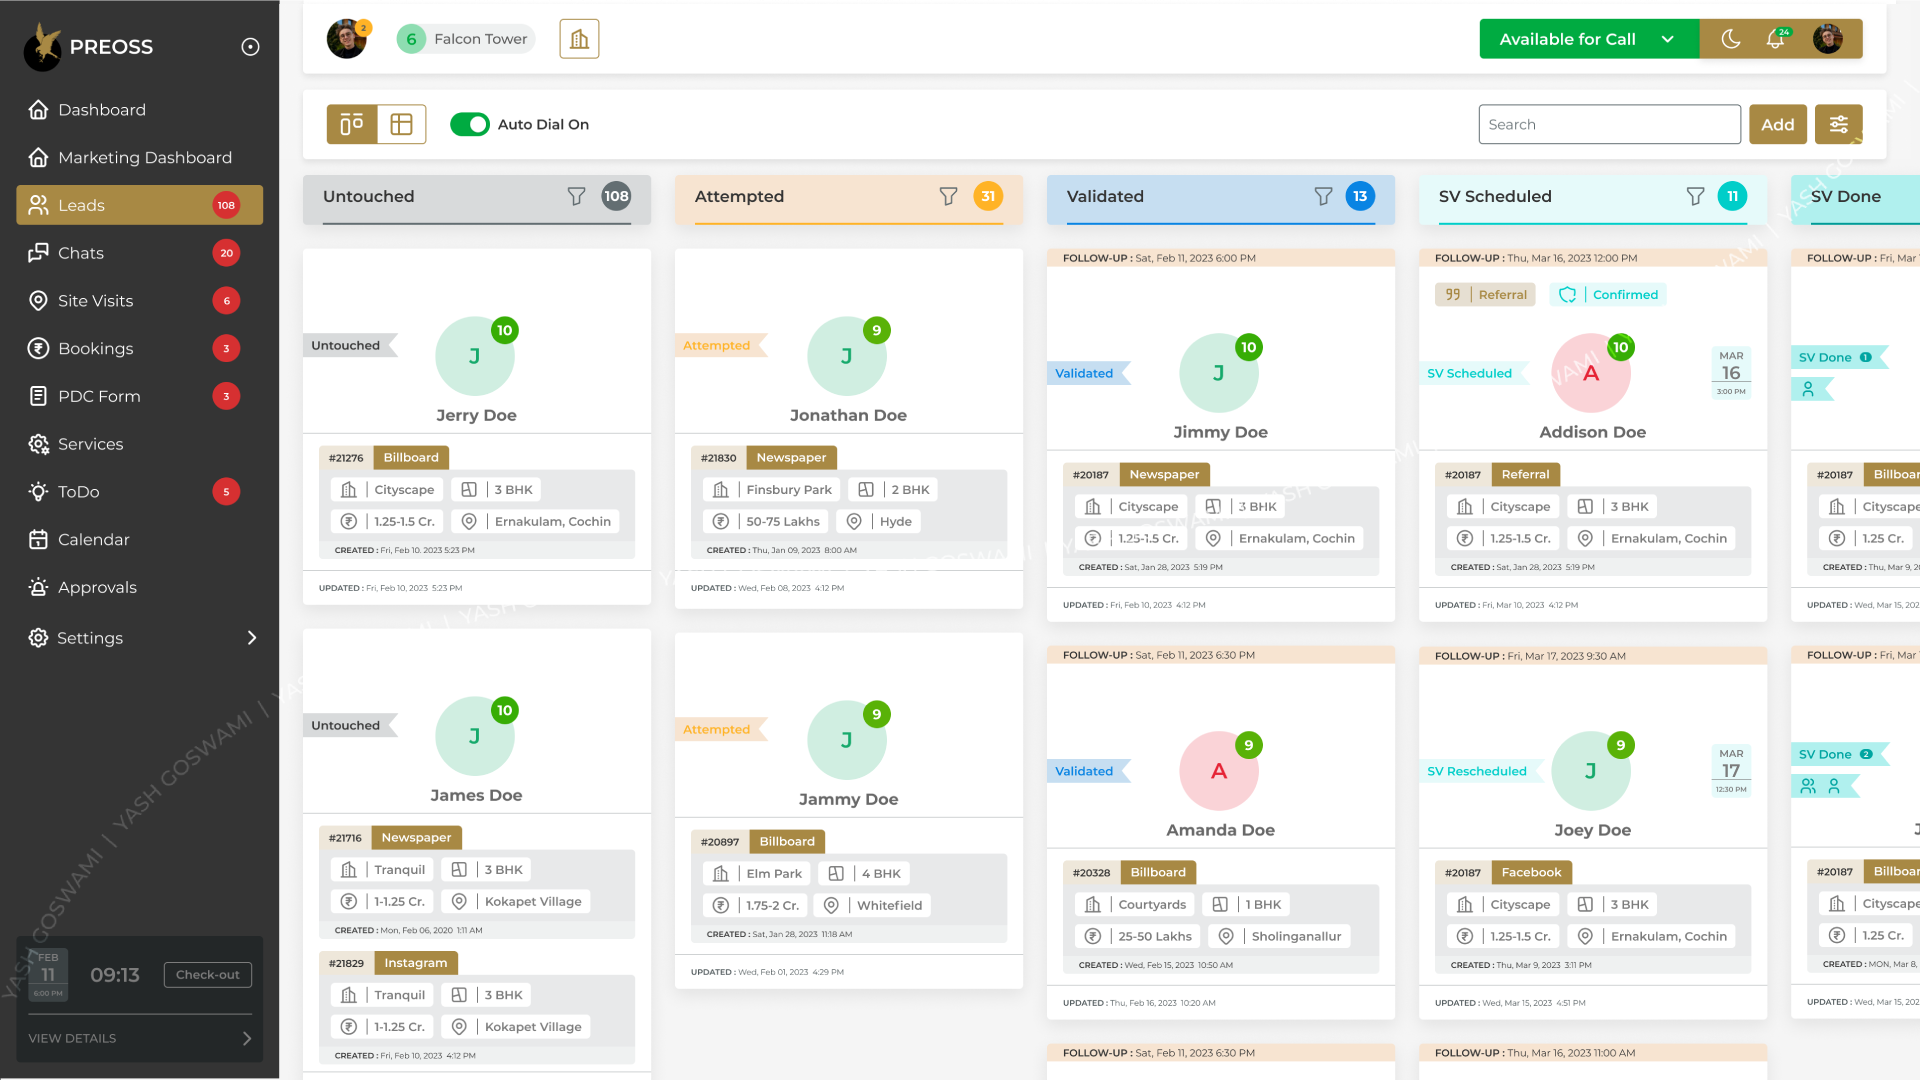
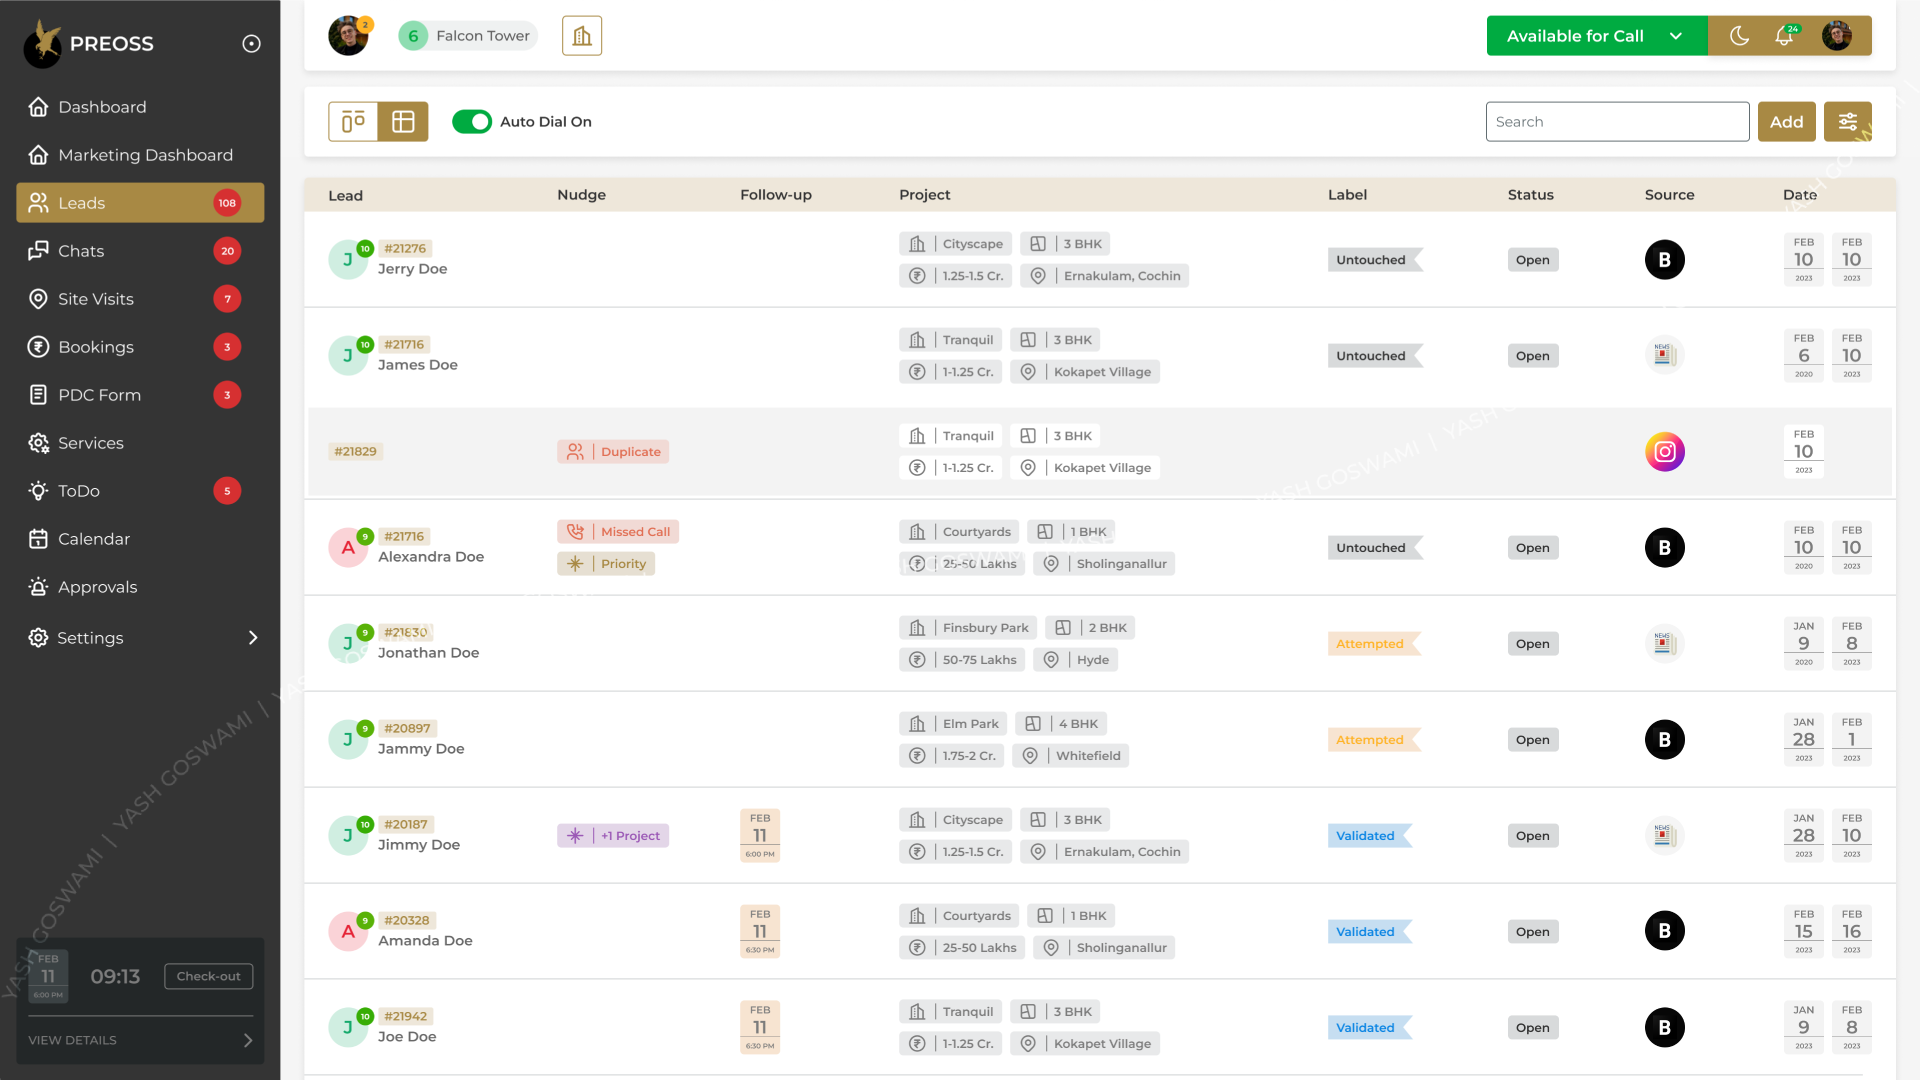
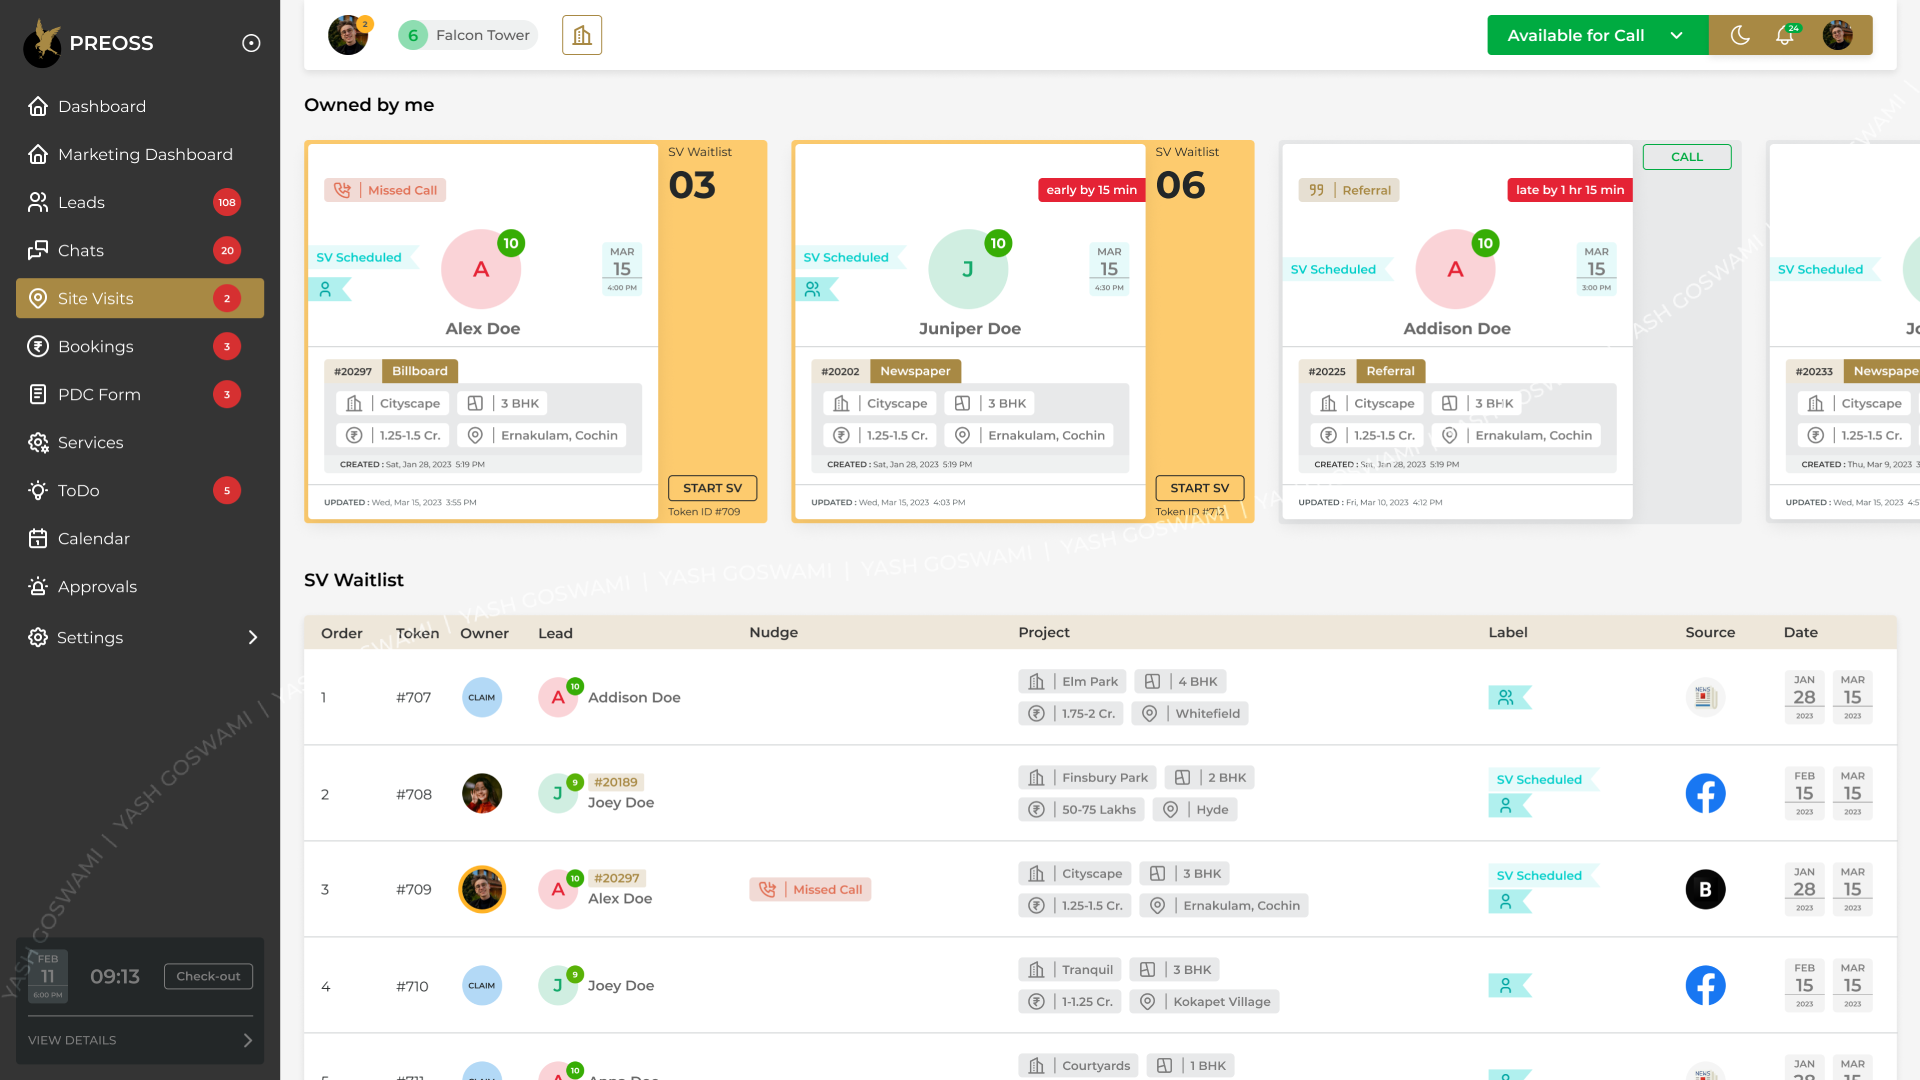
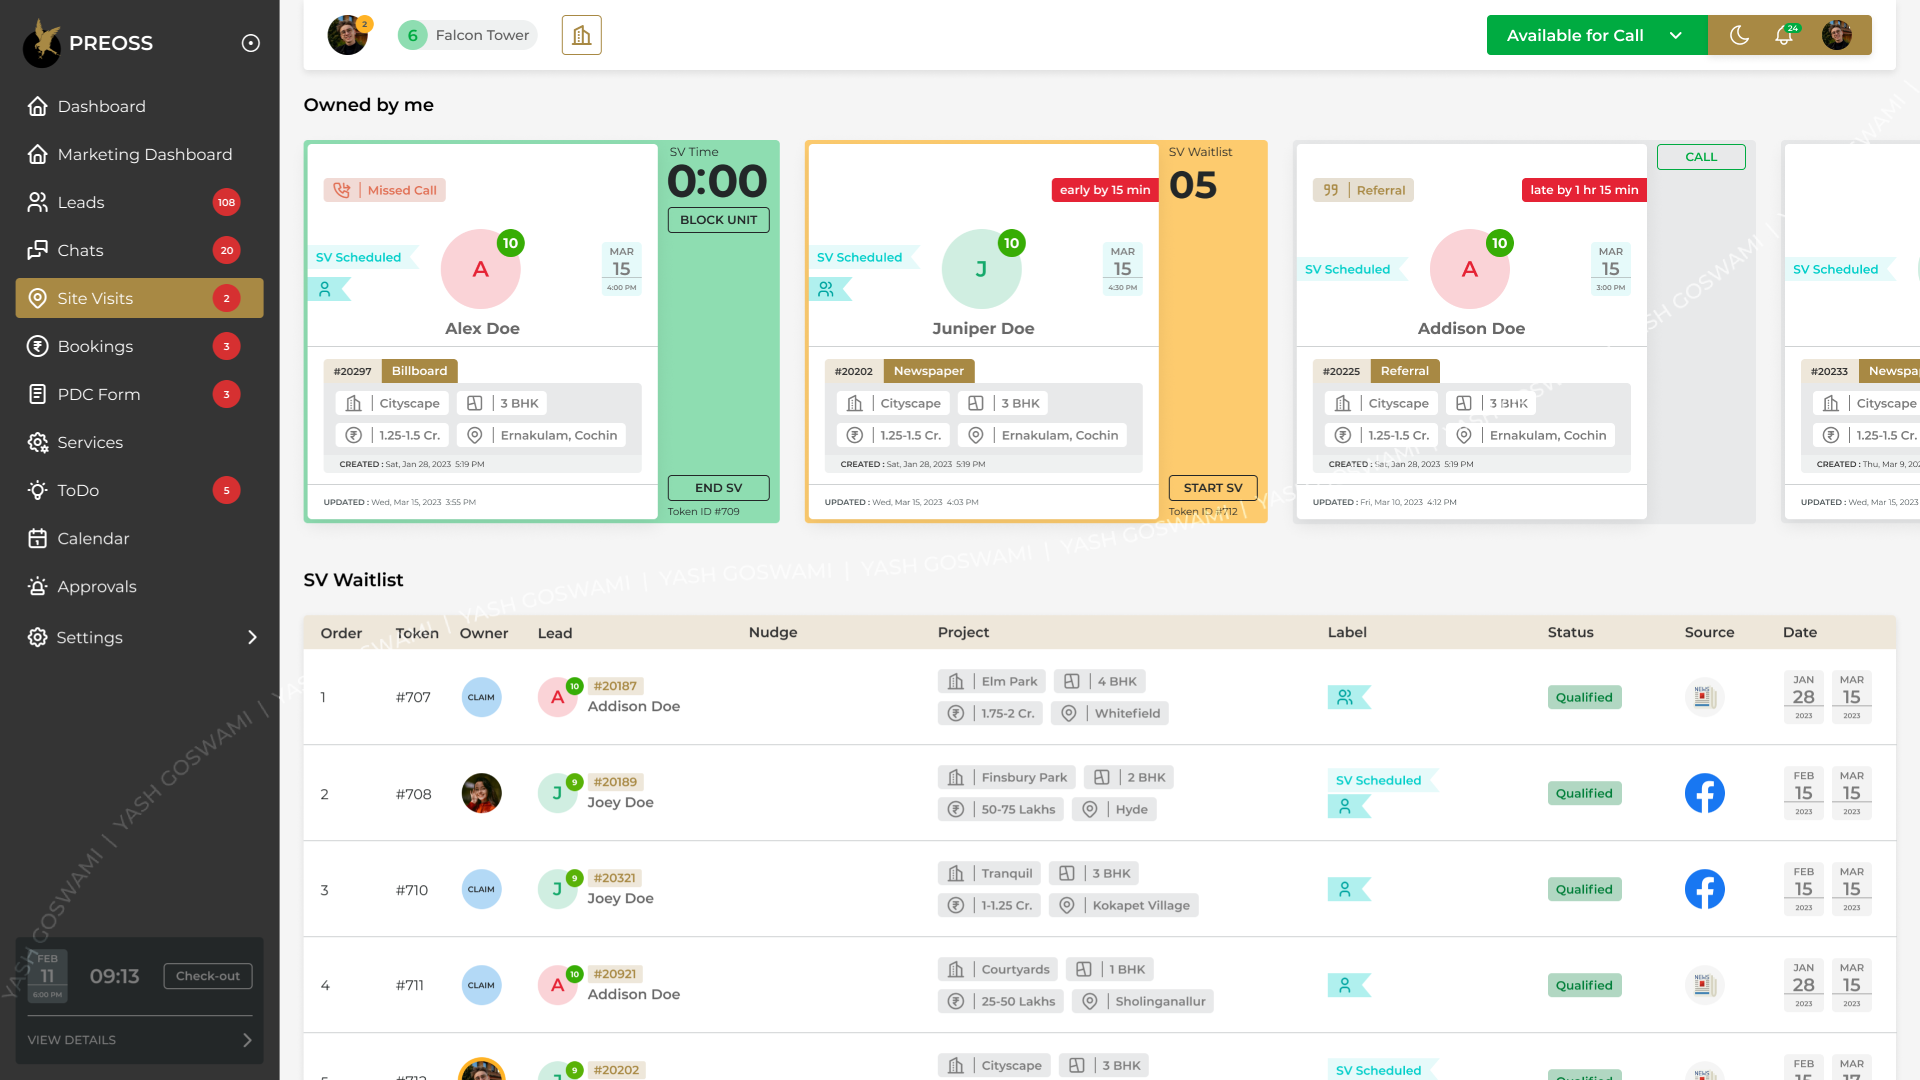
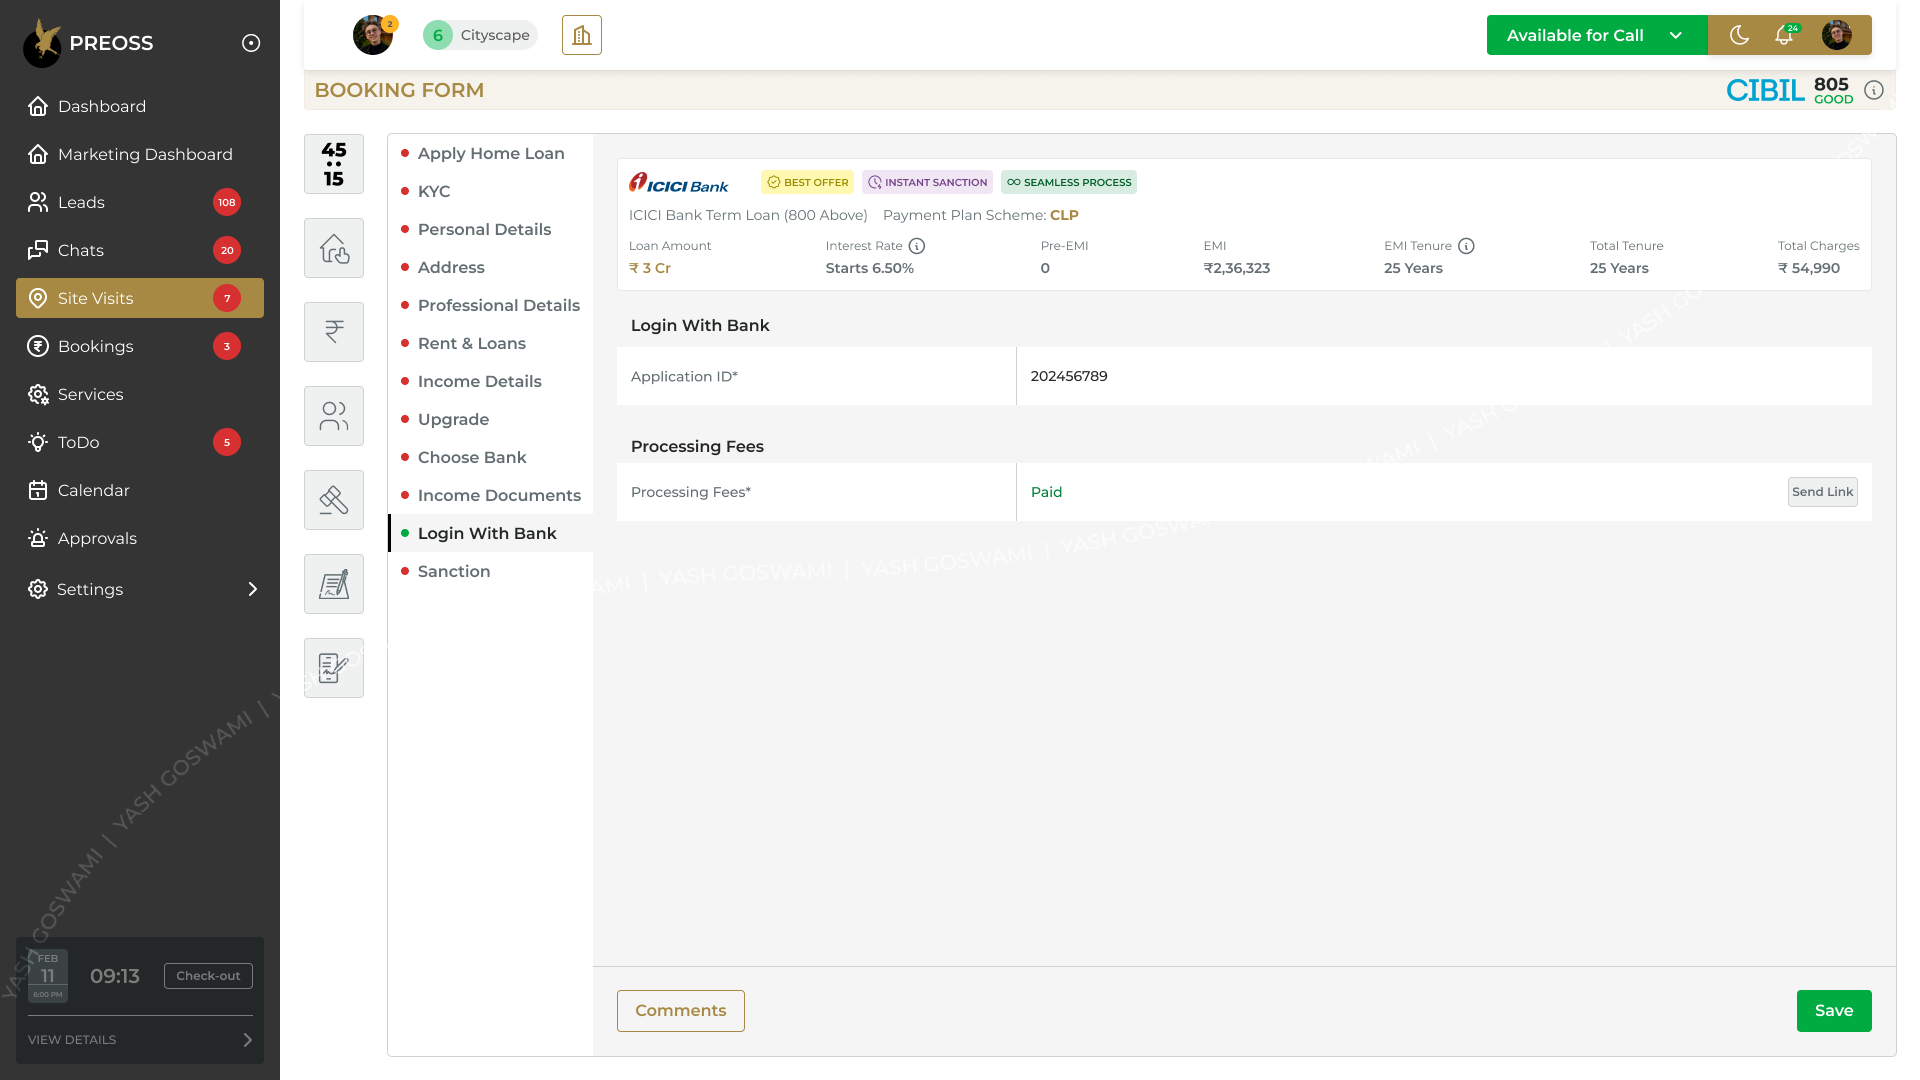
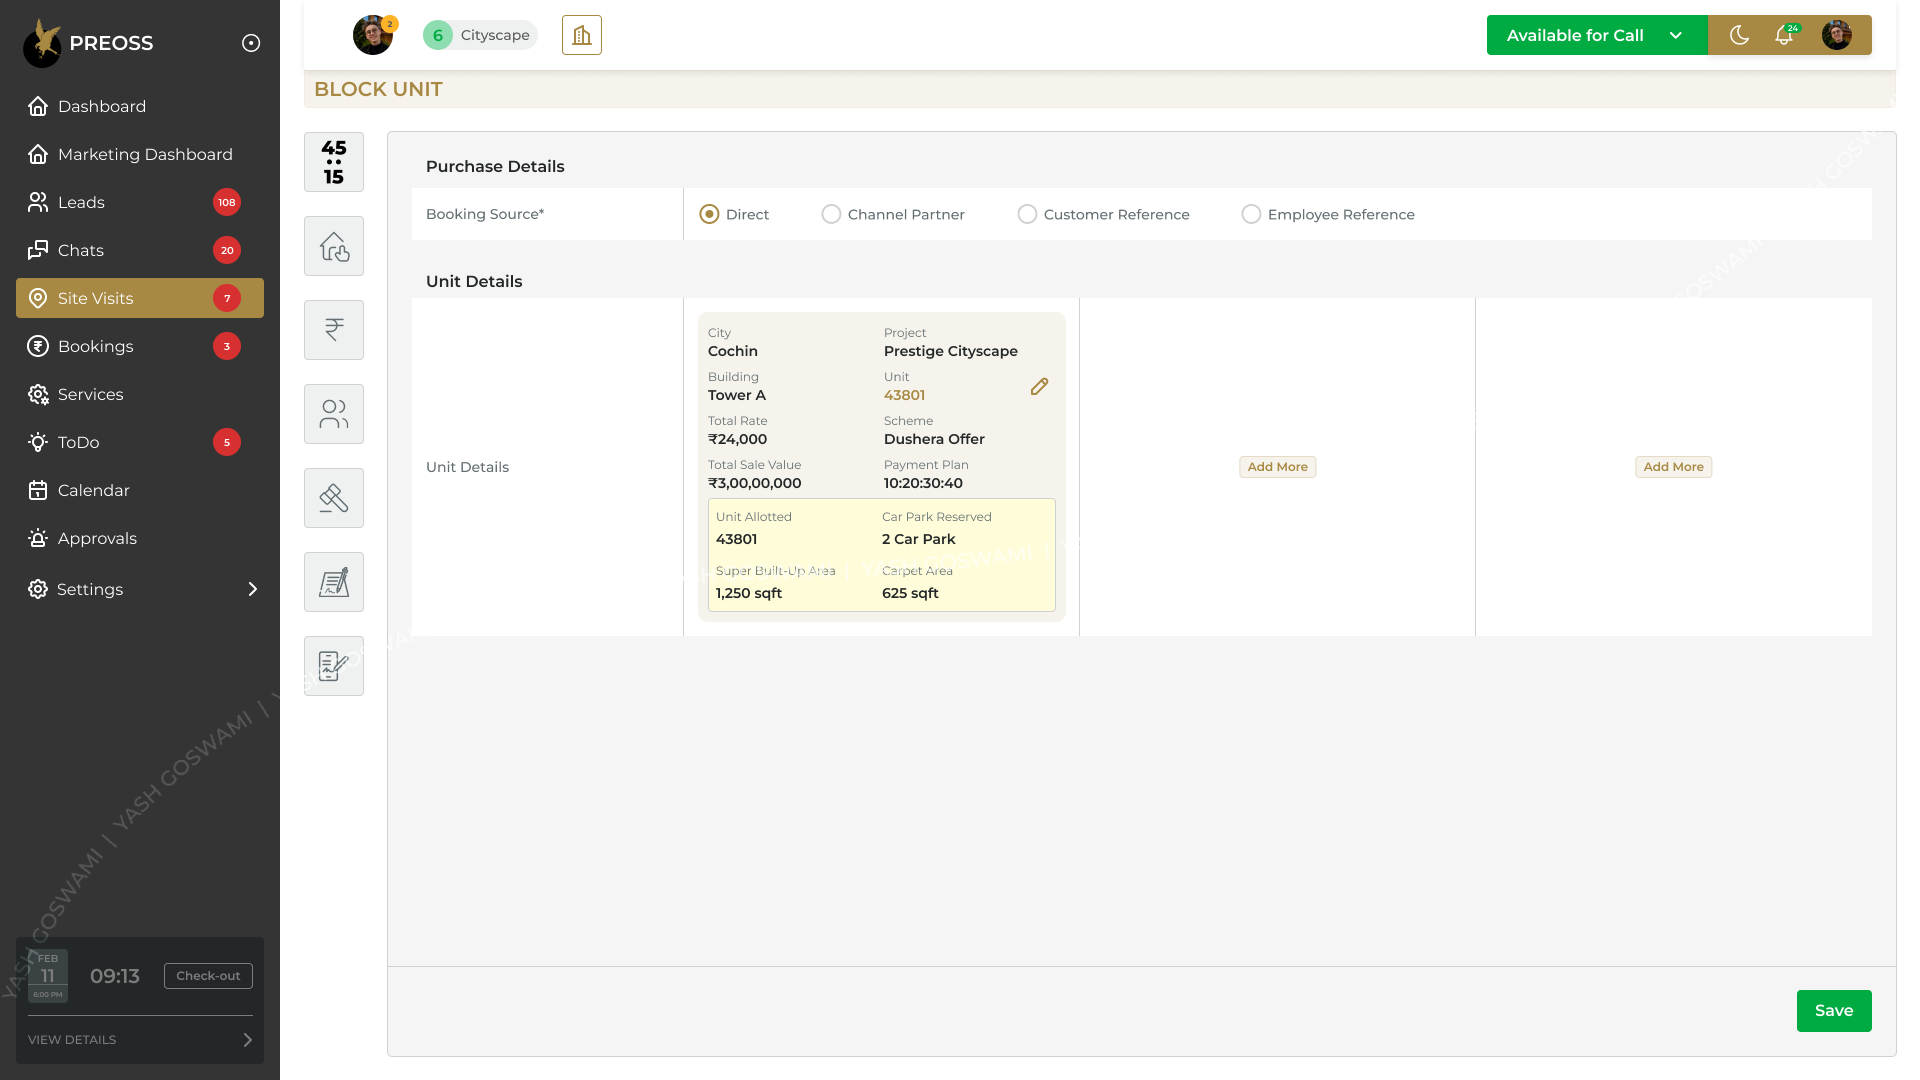
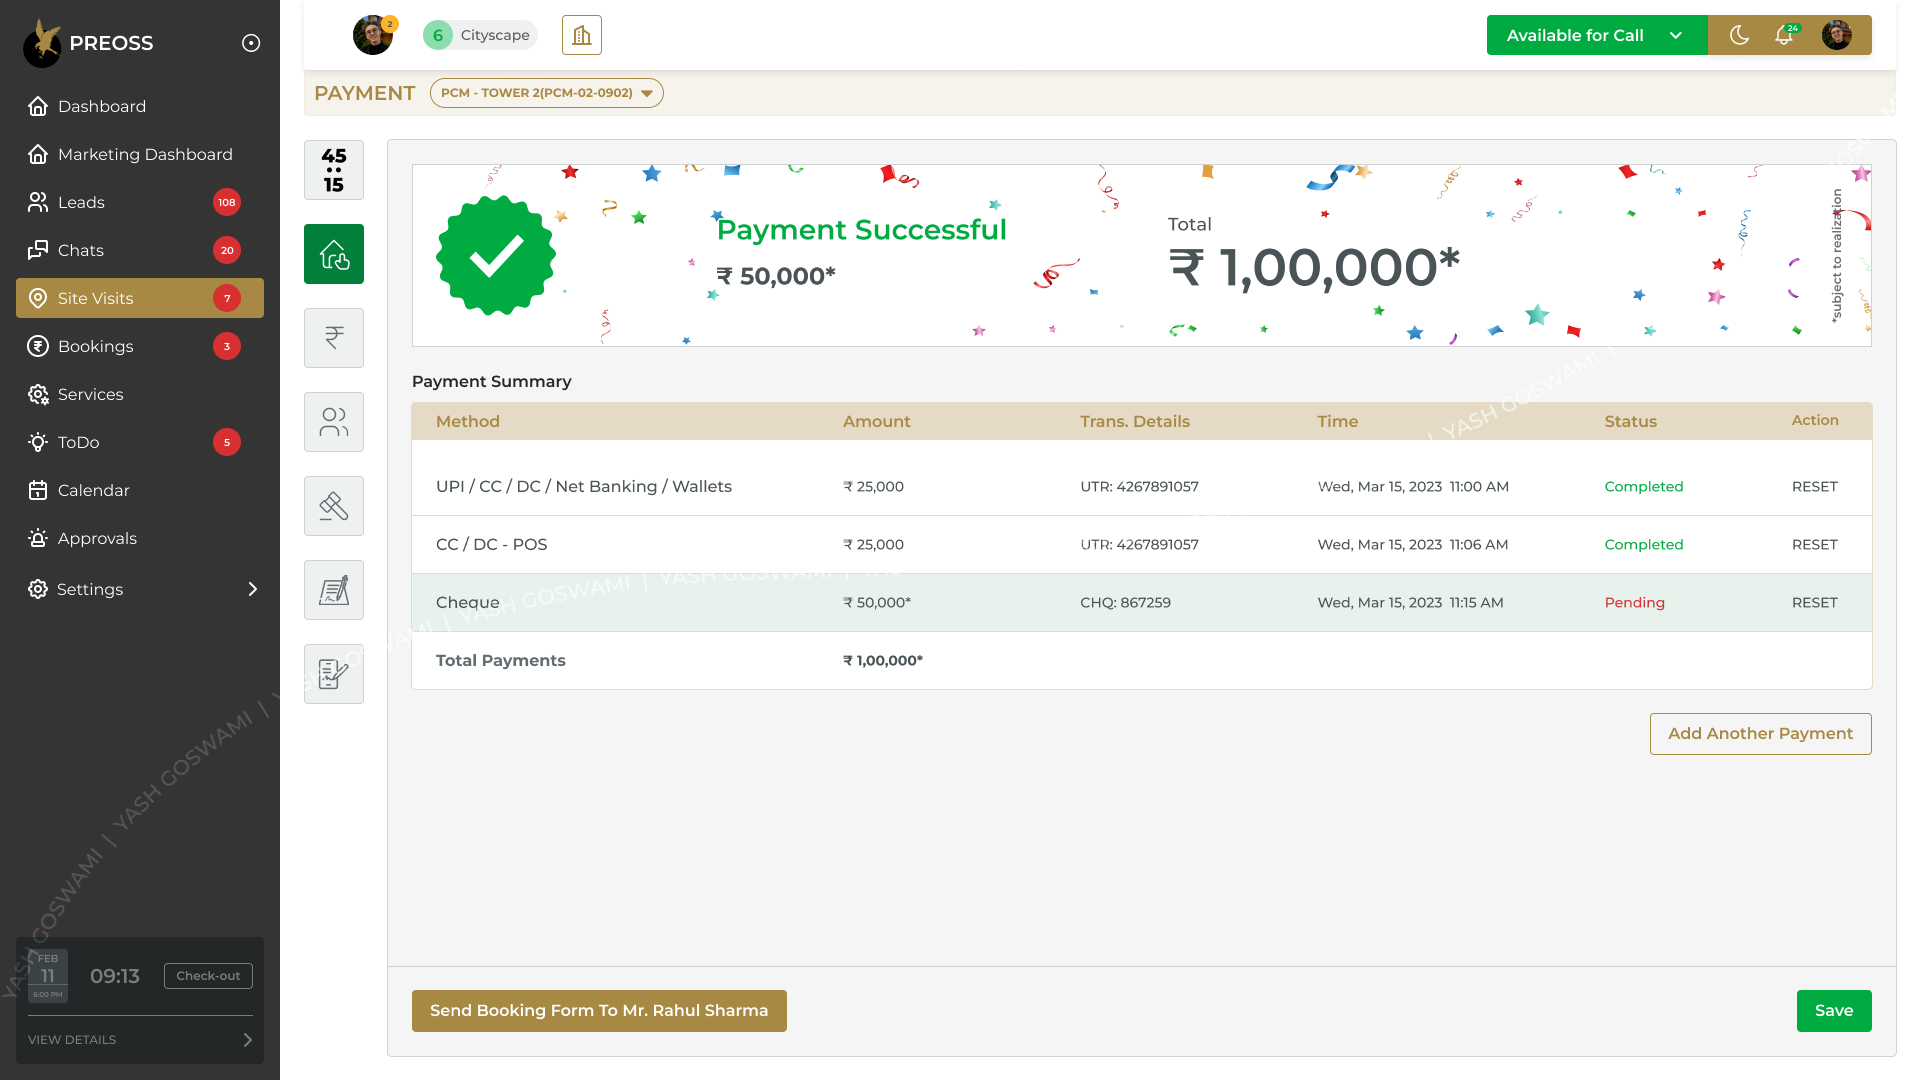
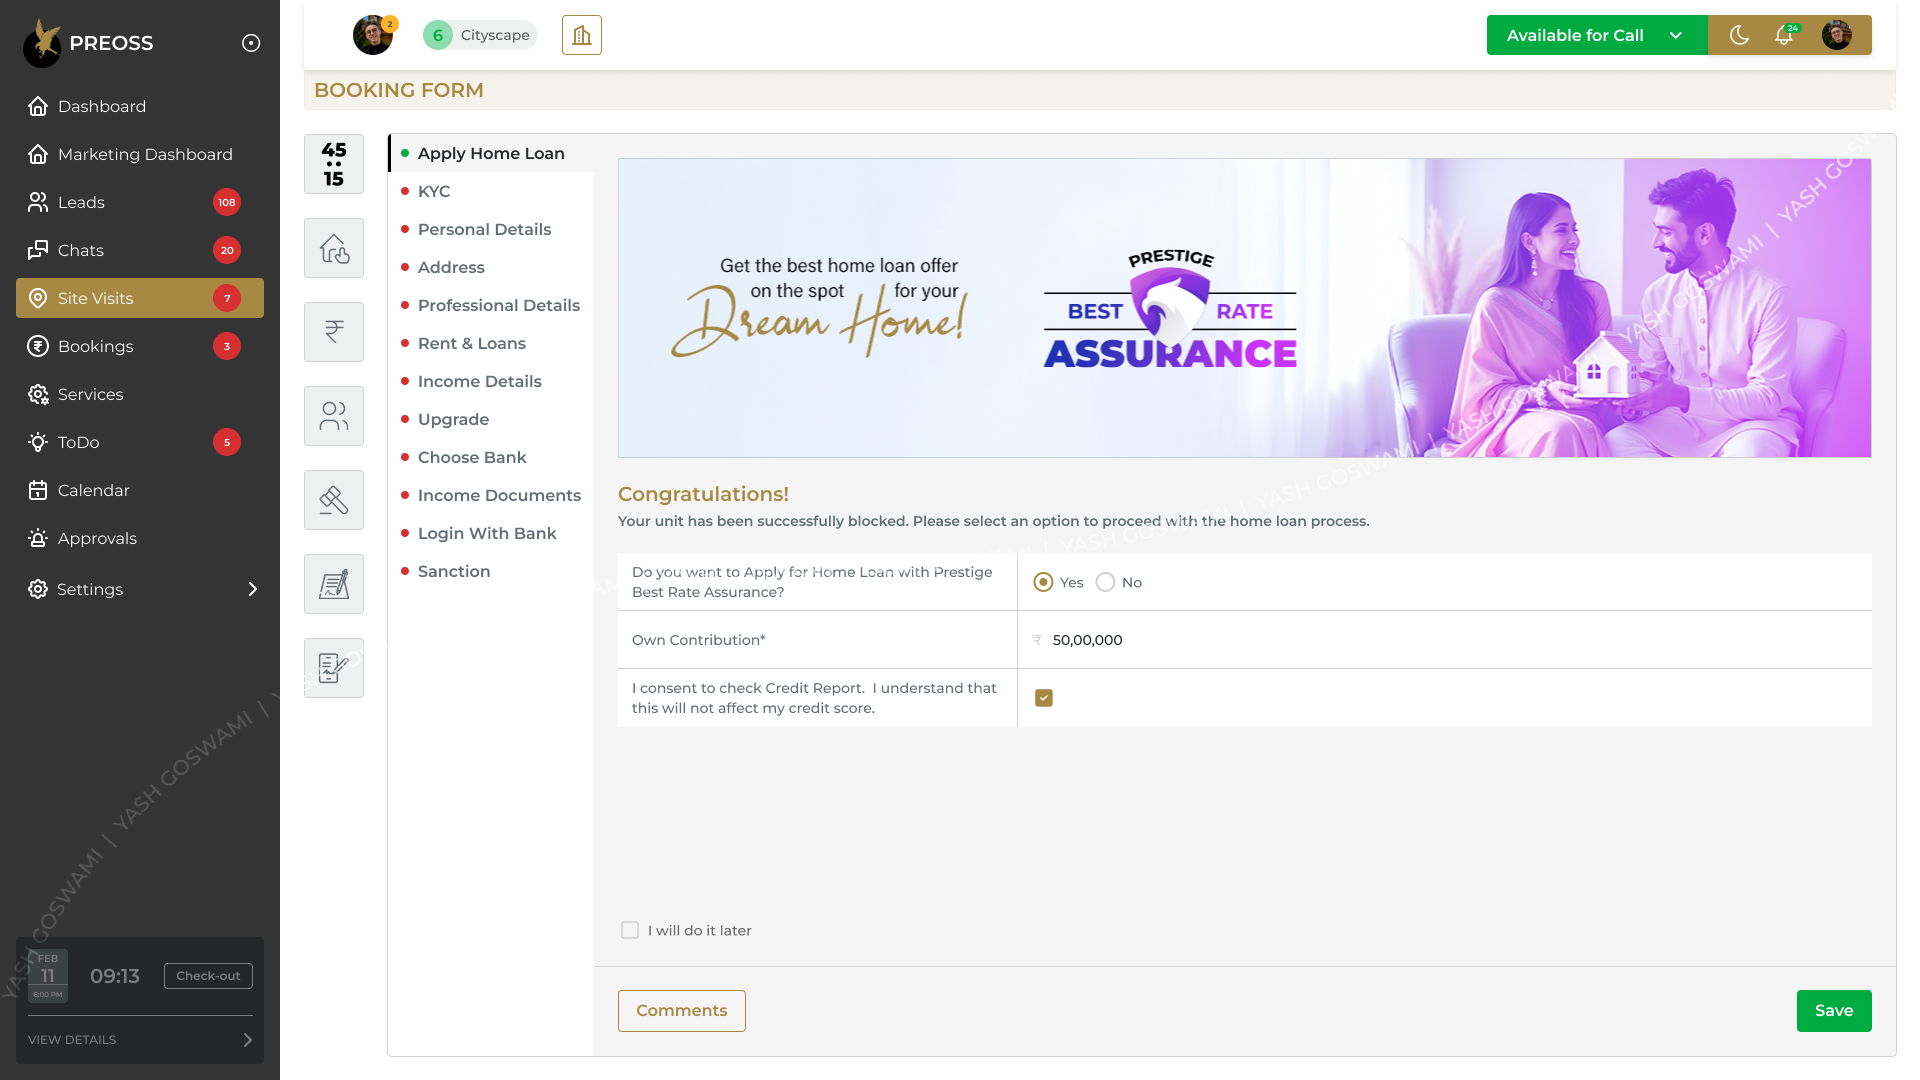
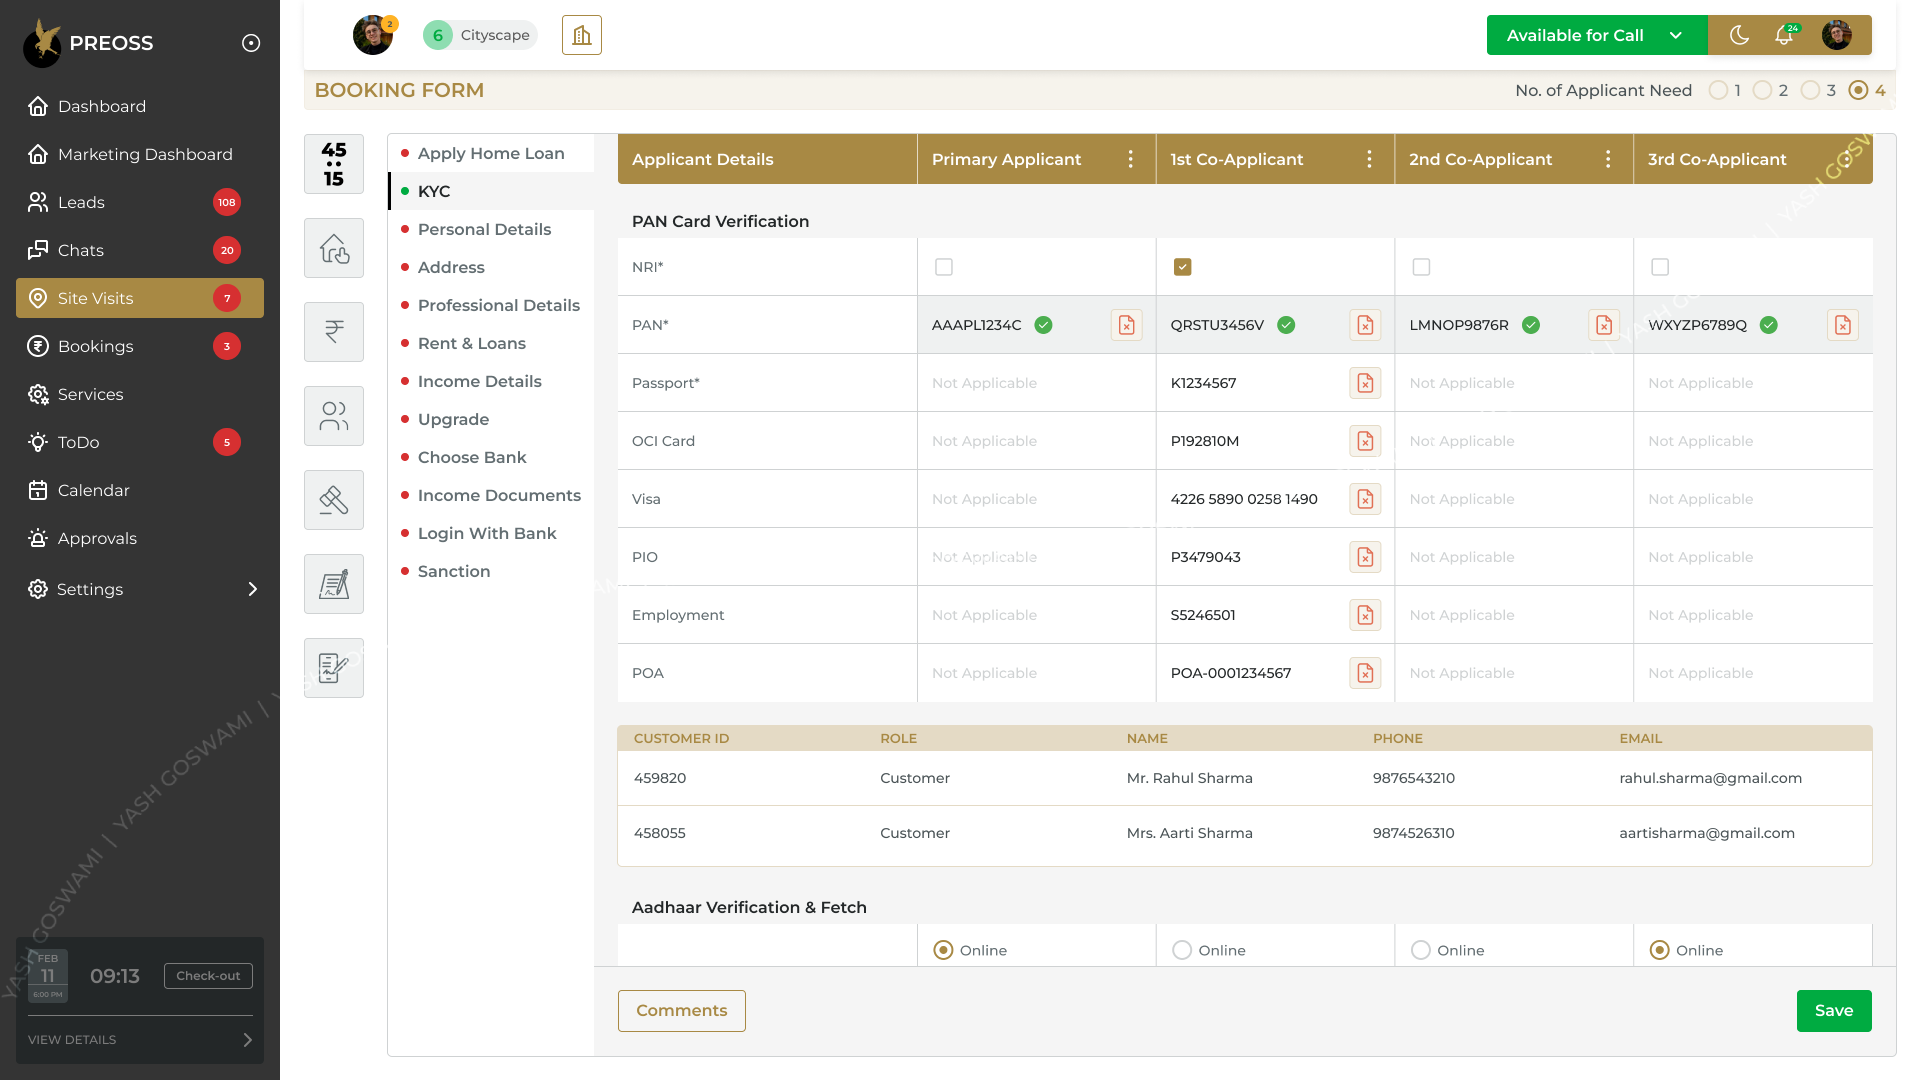
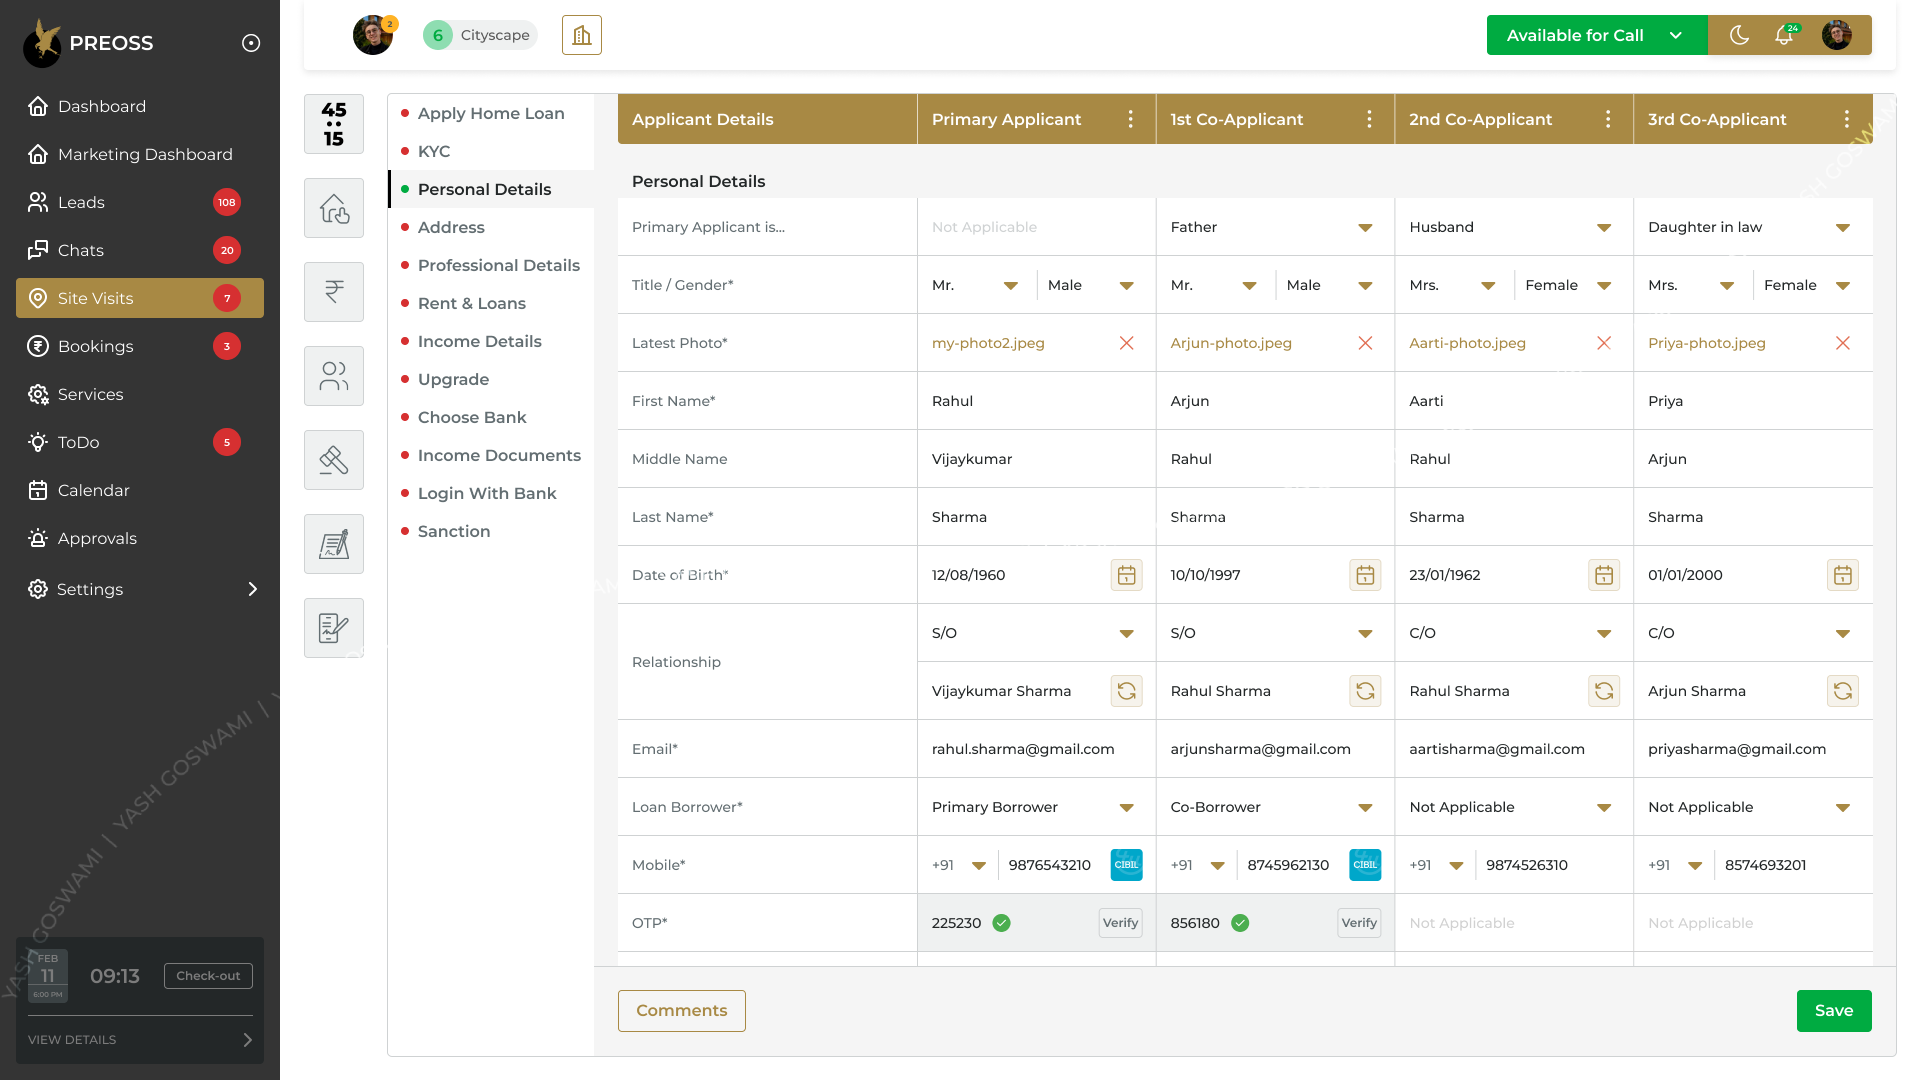
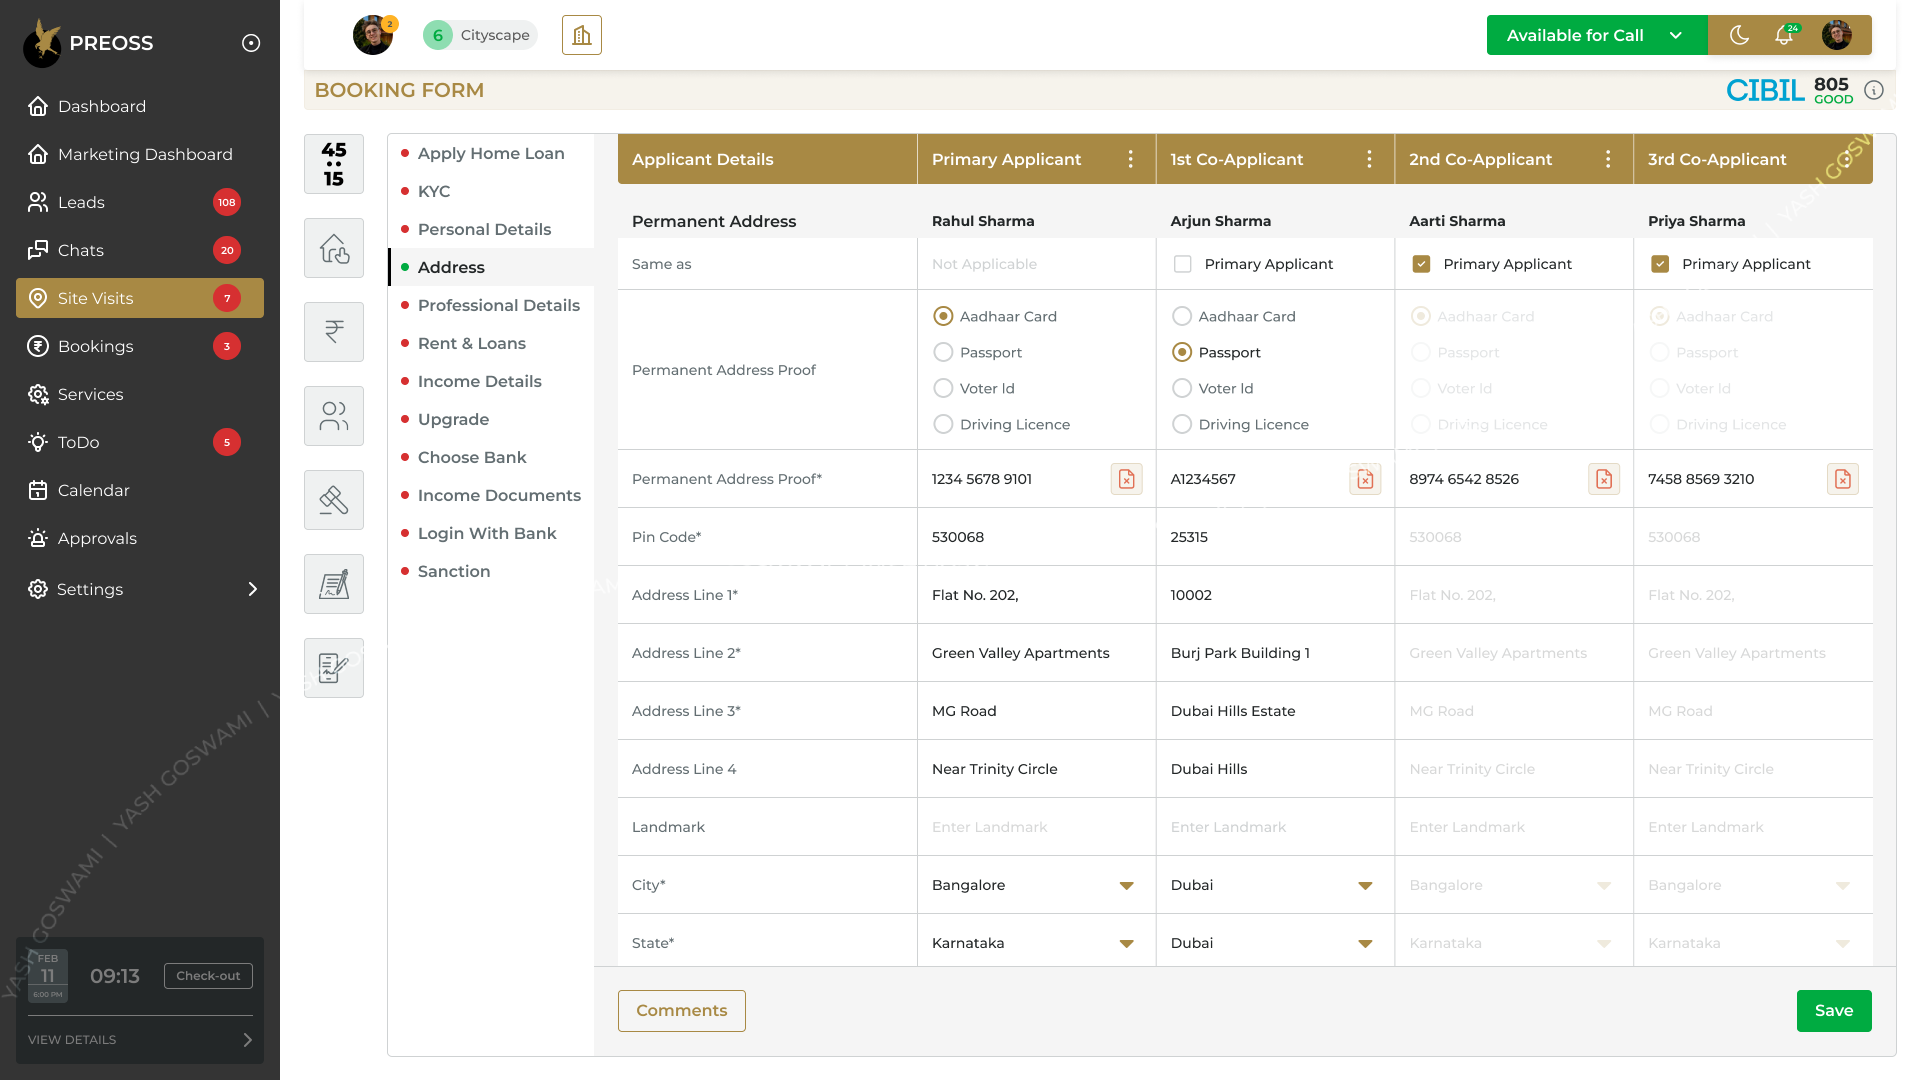
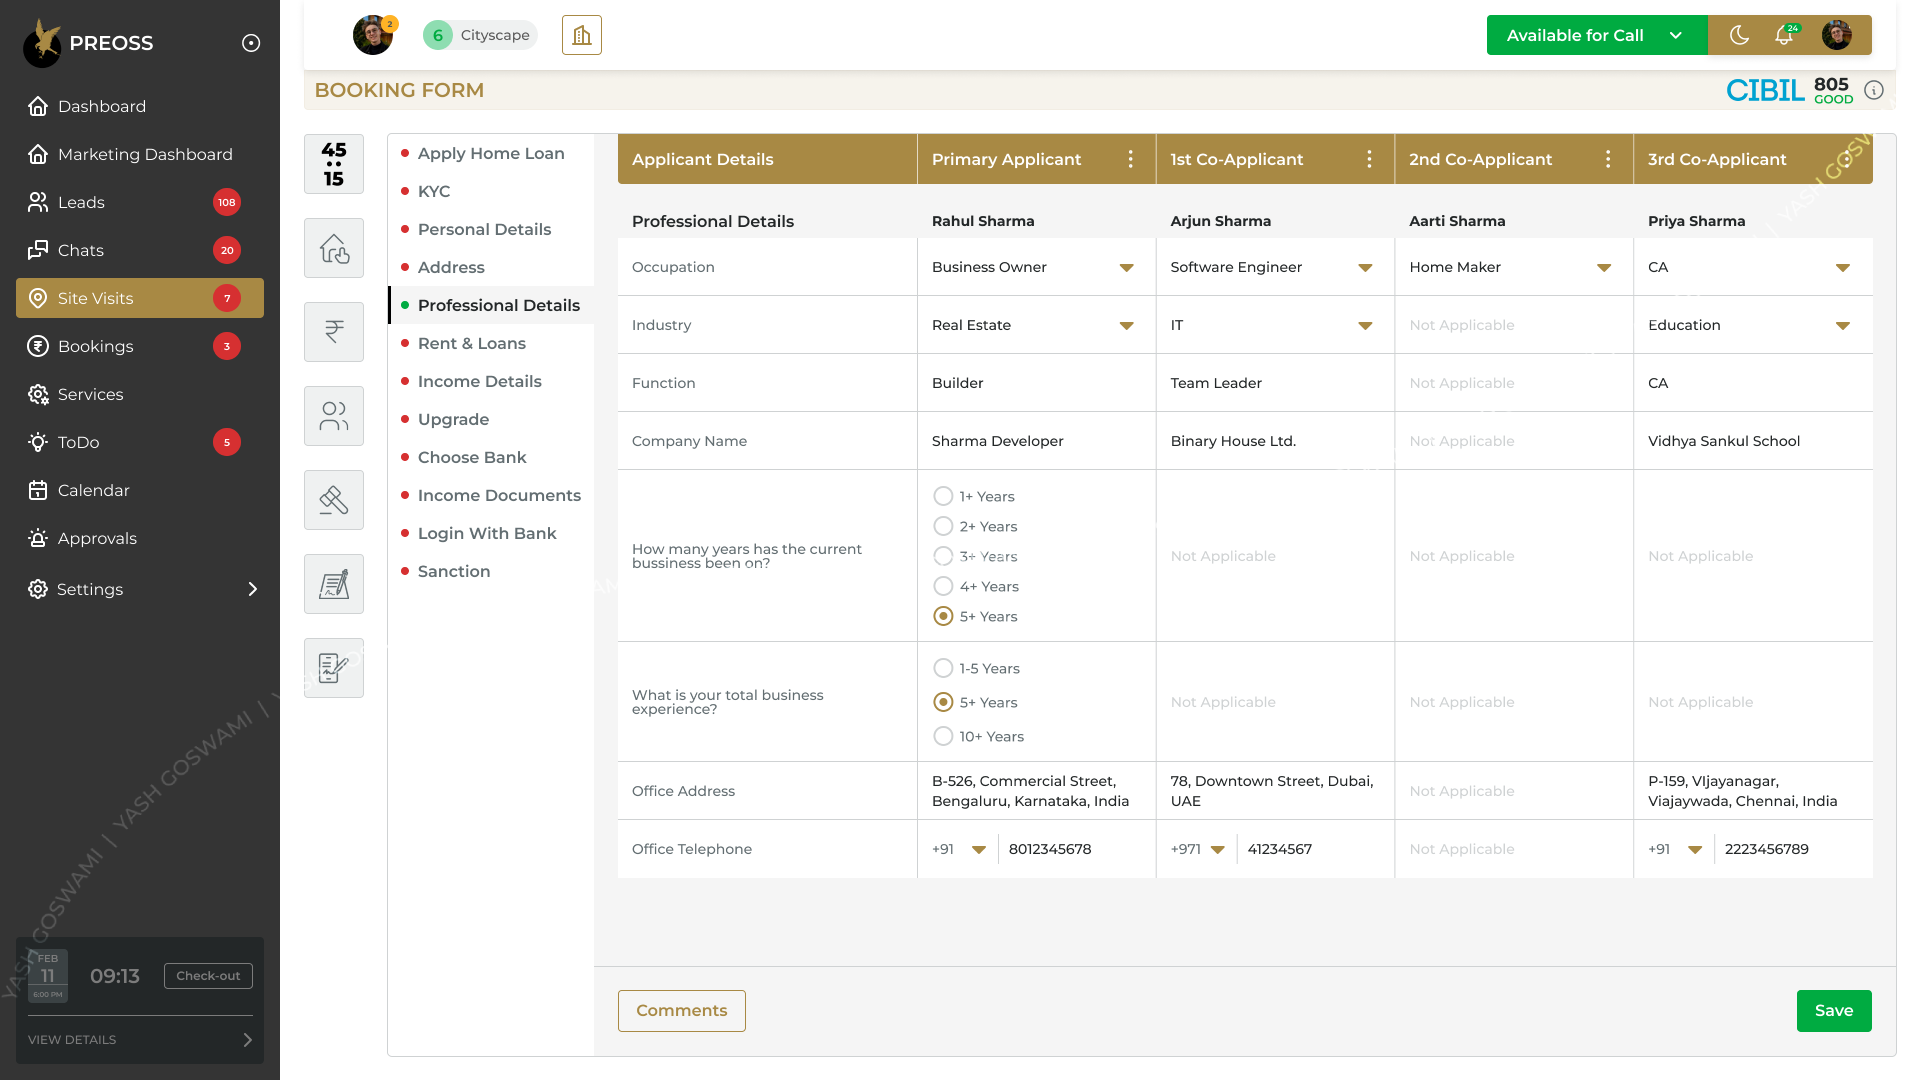
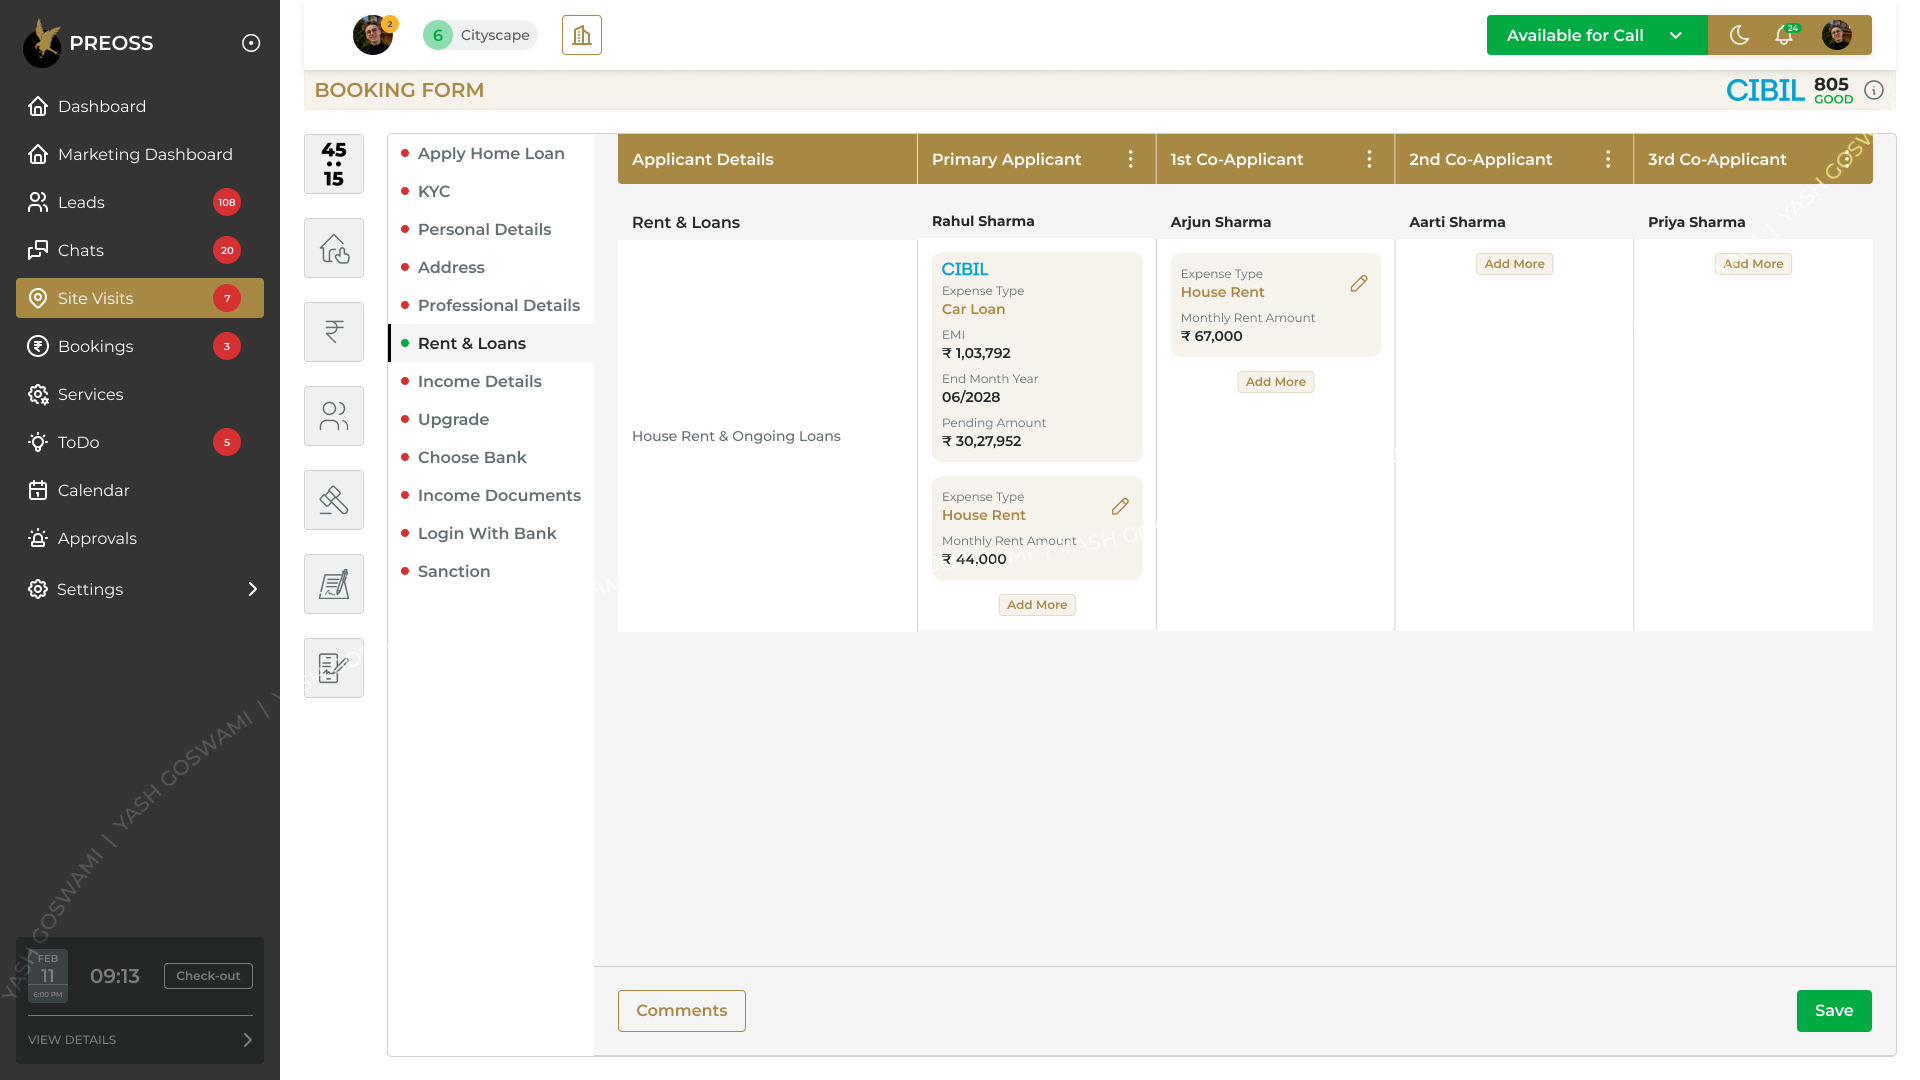
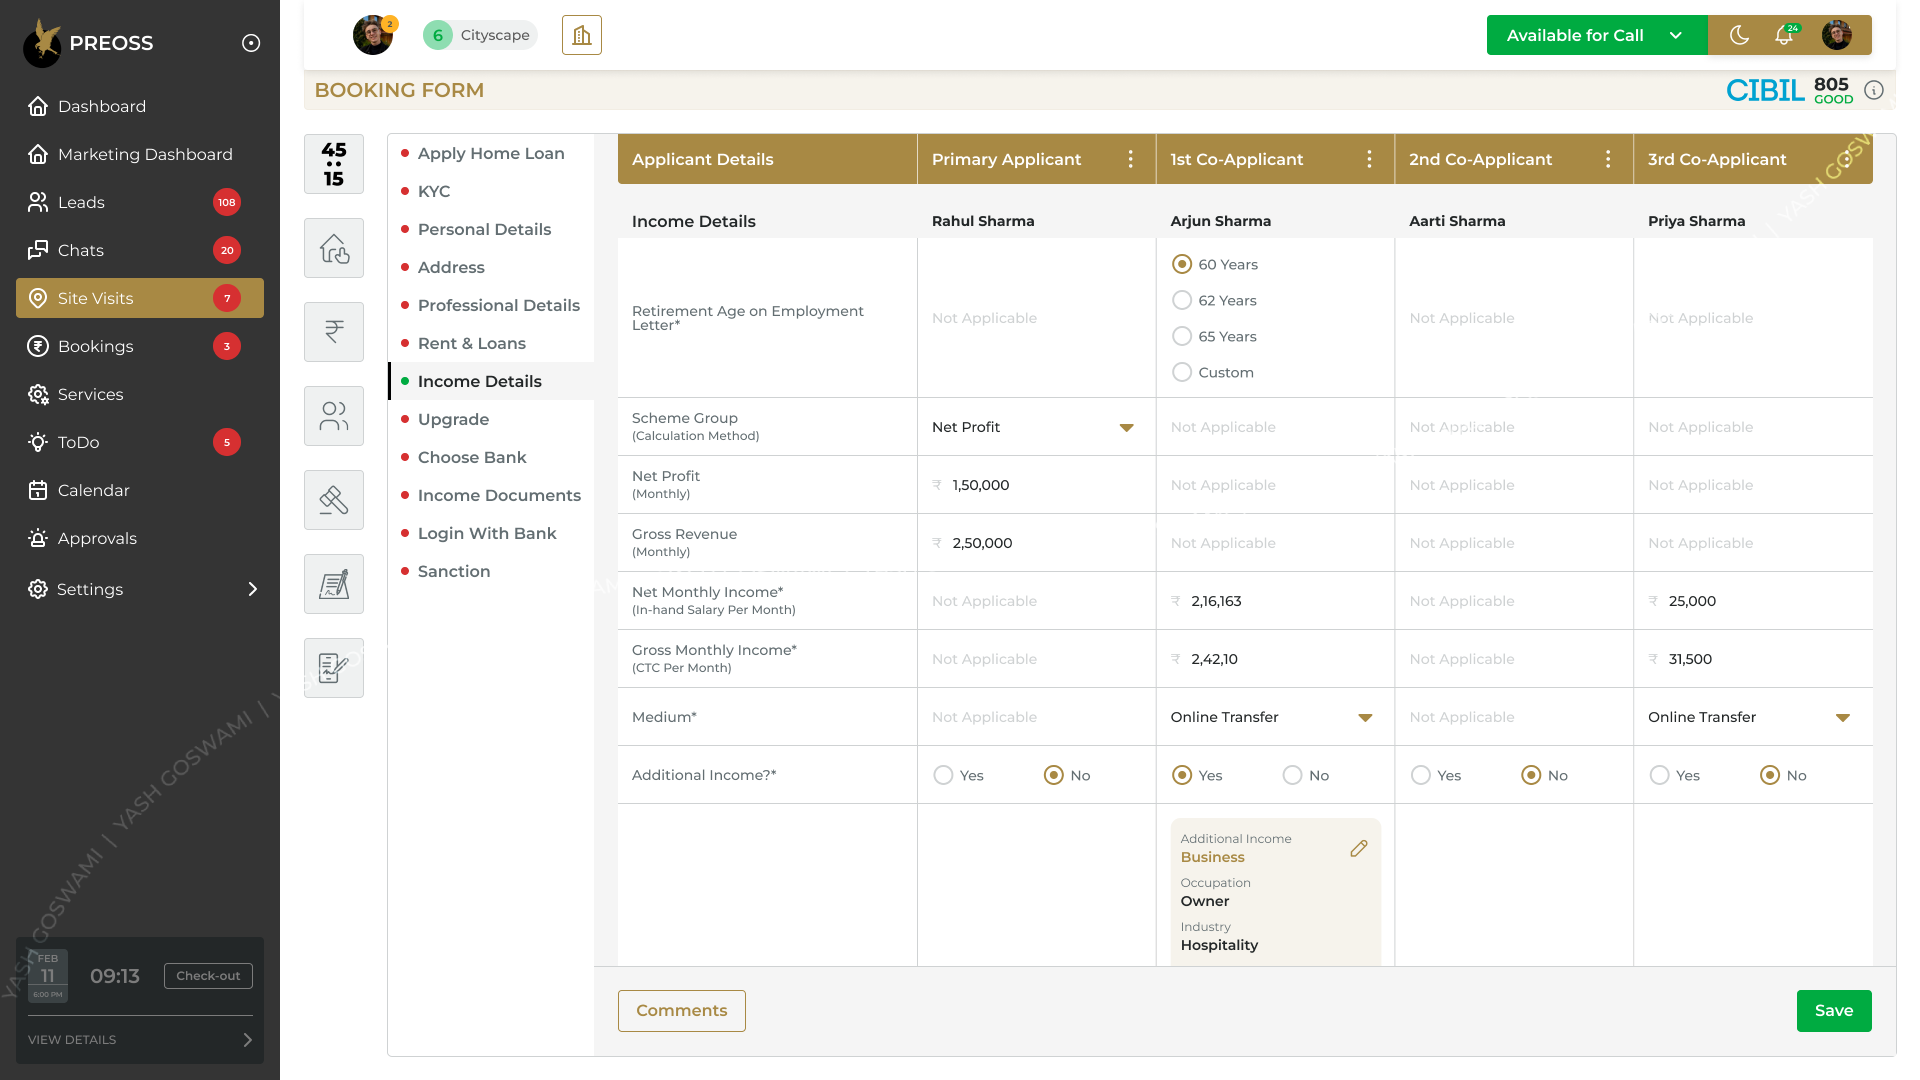
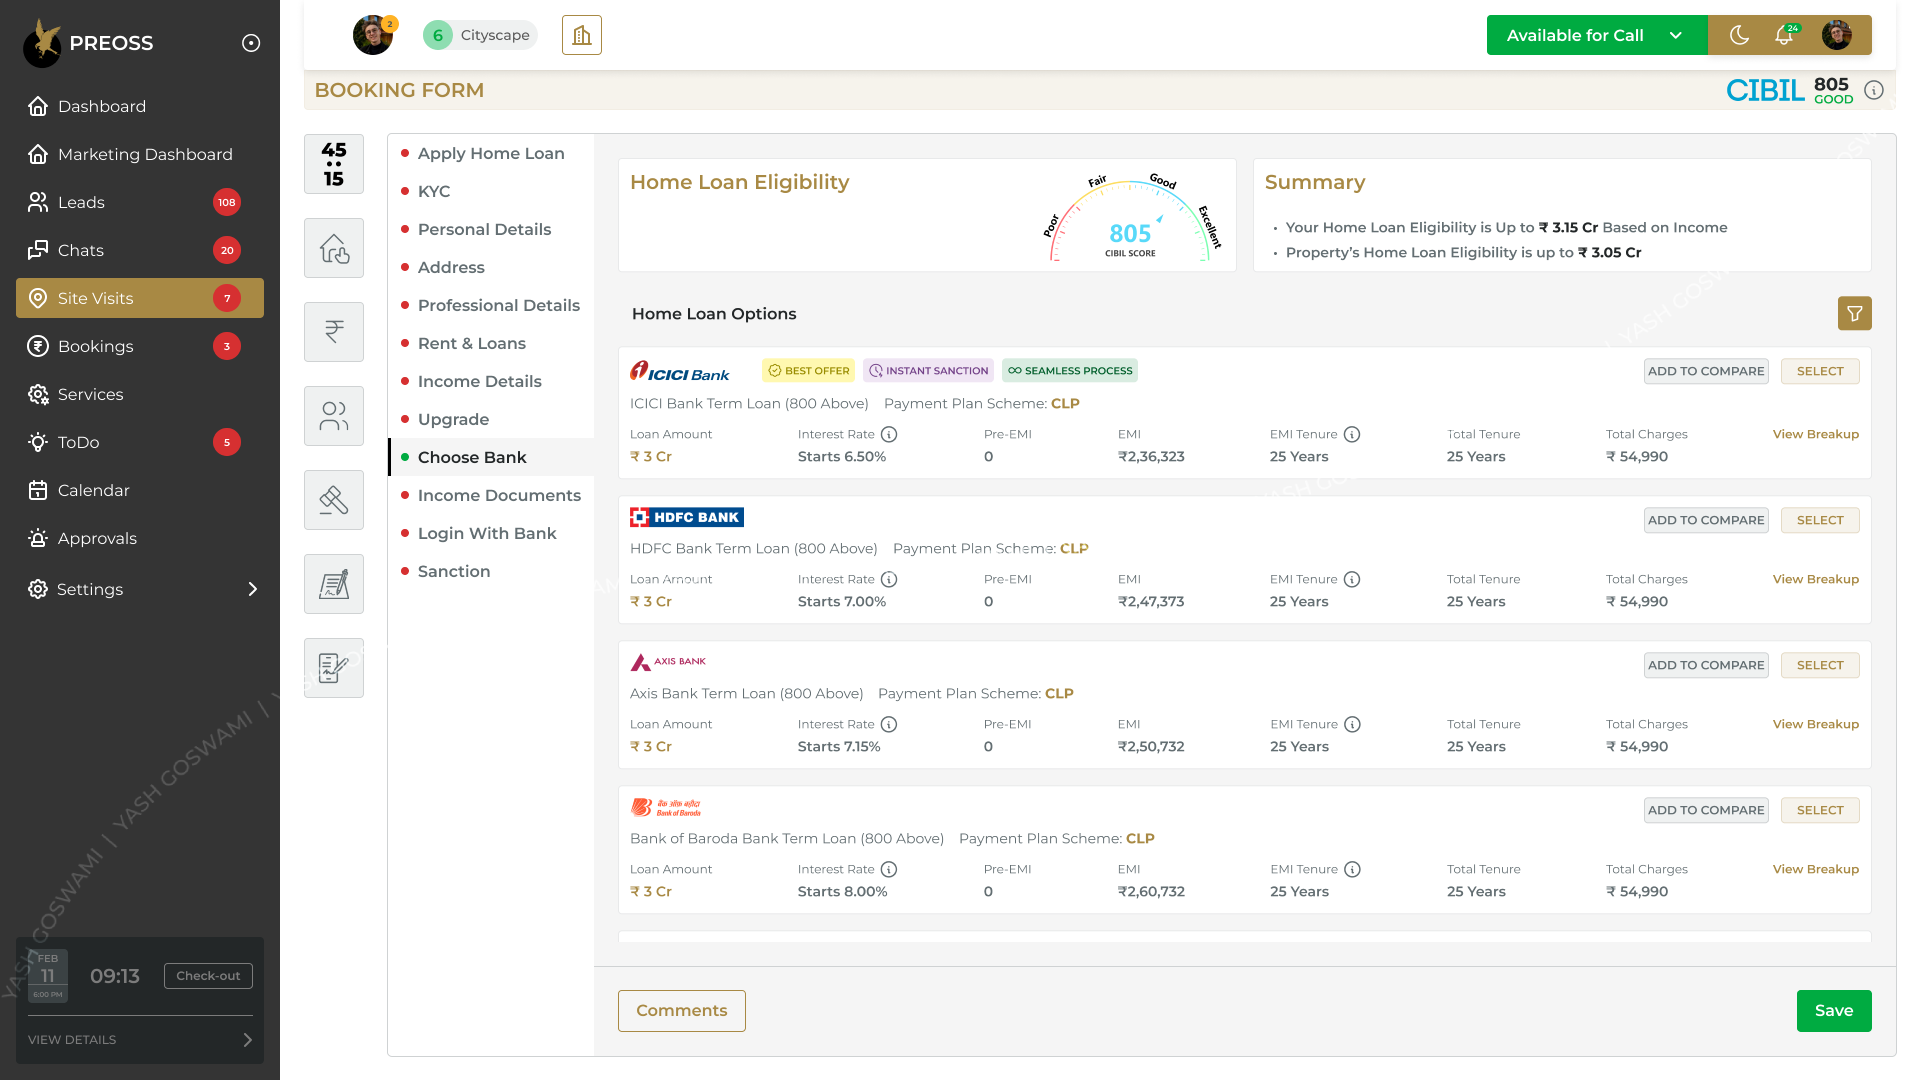
Once validated by GREs, leads move into the Sales Manager CRM where site visit scheduling, on‑ground tracking, unit booking, payments, and home loan assistance run in a streamlined flow. I designed the end‑to‑end journey: Lead pipeline → Site Visit waitlist → Sales Dashboard → Booking & Purchase forms → KYC & Personal Details → Payment orchestration → Home Loan eligibility & bank comparison → Upgrade recommendations.
A well‑defined design system, Auto Layout, and developer‑ready chart configurations (Apache ECharts) ensured faster handoff and gave stakeholders a near‑live prototype experience.
Problem
After GRE handoff, teams often rely on disconnected tools for visits, booking, payments, KYC, and loan processing. This fragmentation causes delays, unclear accountability, and higher conversion drop‑offs.Solution
A unified CRM that covers the complete journey: Lead Kanban → Site Visit queue → Sales Dashboard (KPIs, bookings, productivity) → Booking details & unit selection → Personal details & KYC capture → Multi‑mode payments (UPI, POS, cheque) with running totals → Home Loan module (eligibility, bank comparison, sanction options) → Smart upgrade recommendations. Analytics UI used real Apache ECharts option objects so developers could plug in data quickly.Impact
- Accelerated site‑visit→booking conversions with clear queue management.
- Reduced drop‑offs by consolidating booking, payments, and loan steps.
- Saved engineering time via reusable chart options and structured forms.
- Enabled management to track live‑like dashboards for visits and rankings.
My Responsibilities
- Owned end‑to‑end design from research to high‑fidelity delivery and developer handoff.
- Collaborated with PMs and engineers to shape flows and constraints.
- Crafted accessible interfaces with clear hierarchy and interaction patterns.
- Prototyped & validated site visit, booking, and loan flows via usability testing.
- Created a design system with tokens, components, and layout rules for consistency.
- Backed decisions with funnel metrics and productivity insights.
- Delivered developer‑ready ECharts configs to accelerate dashboard build.